When I first showed the report to people, I got an honest answer: the numbers are there, but it isn’t clear what to take from them. They were right. The report was a collection of cards and charts, and the story between Vienna and Bratislava was left for the reader to guess. So I rebuilt it.
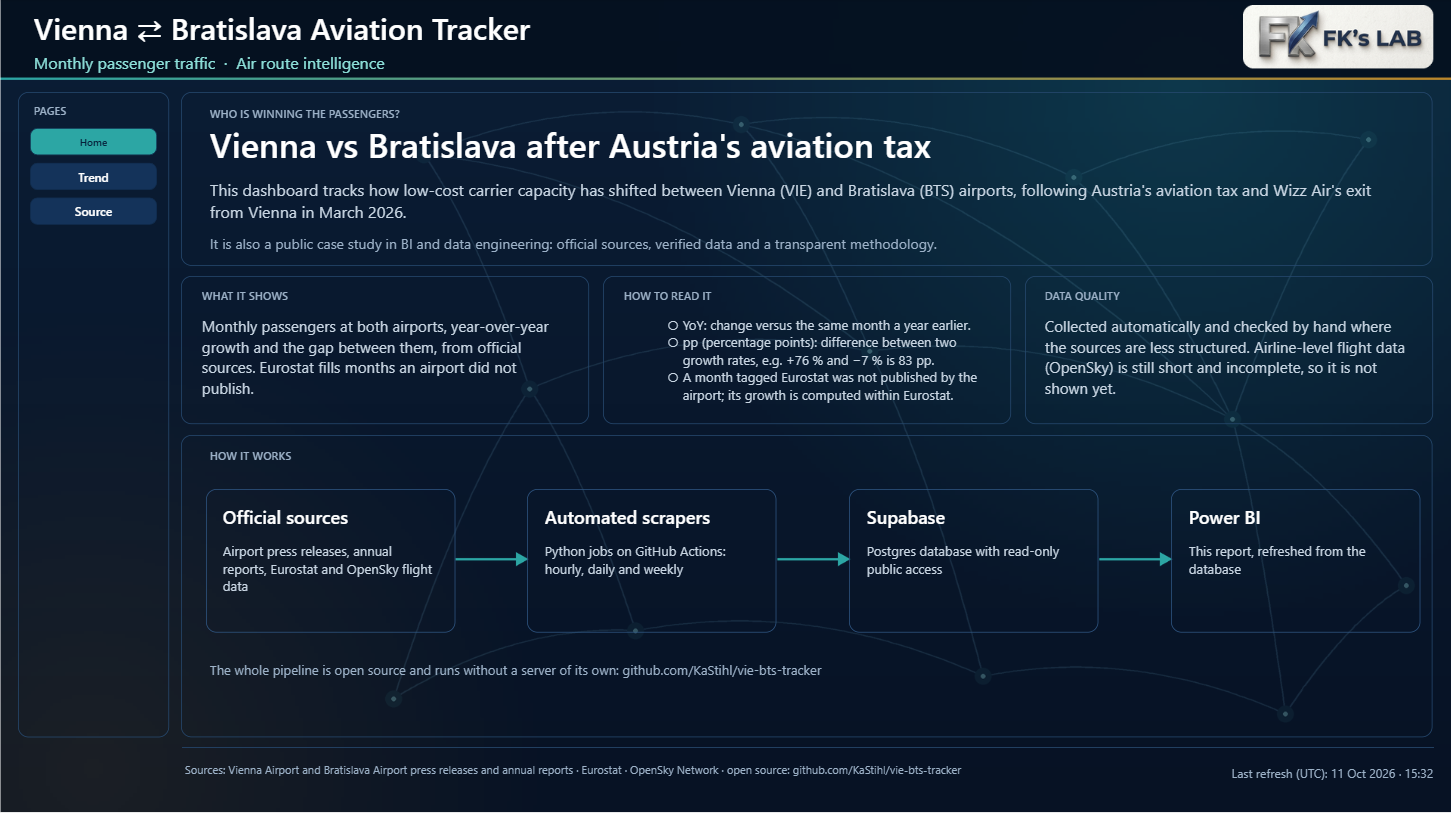
Home: explain first, then show
The first page is no longer another panel of numbers. It’s an introduction: what the report is about, how to read it and how far to trust it. It also explains pp (percentage points), the abbreviation nobody understood in the first version: the gap between +76 % growth and −7 % decline is 83 pp, not 83 %. At the bottom, a diagram shows how it works, from official sources through scrapers and the database to the report.
Trend: every card answers one question
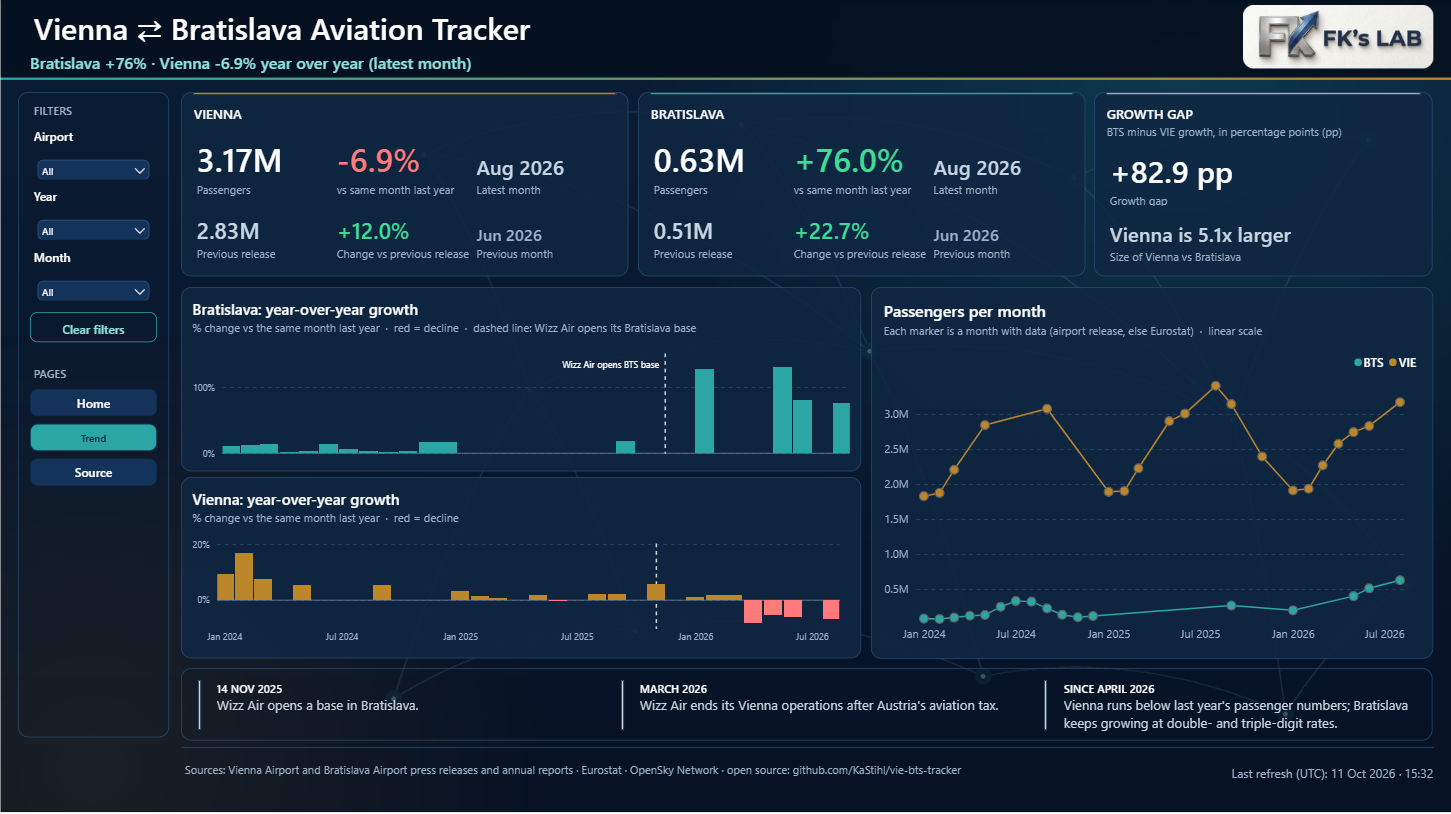
- Previous release. Each airport card shows the current month, the year-over-year change and the previous month, so you see at once whether a trend is speeding up.
- Red declines. Year-over-year change is a separate chart per airport with its own axis. Growth is in the airport’s colour, declines are red. On a shared axis, Vienna’s decline (−5 to −8 %) would disappear next to Bratislava’s growth (+76 %).
- Growth gap. A separate card shows the difference between the growth rates in pp and the size ratio of the two airports.
- Timeline. Three events under the charts explain the story: Wizz Air opens a base in Bratislava, ends operations in Vienna, and Austria introduces its aviation tax.
Source: where the numbers come from
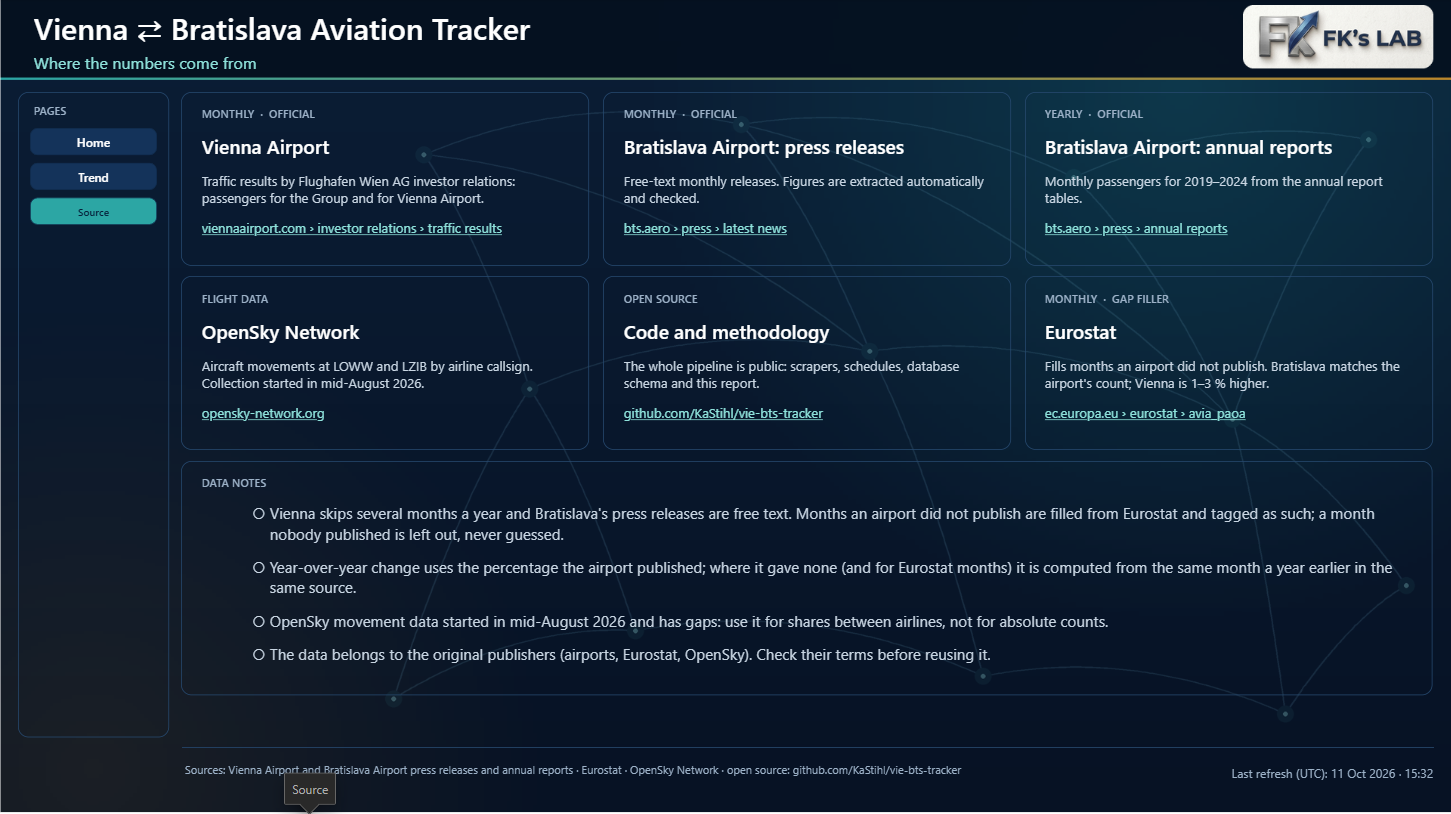
Every source has its own card with a link, and the notes explain what happens when a figure is missing. That matters because official sources are not complete.
The missing July, and what to do about it
While checking, I found that July 2026 was missing from the data. That’s not a scraper bug: Vienna doesn’t publish press releases for some months (most often July, October and December), and Bratislava publishes irregularly: for 2025 the database has only 7 of 12 months.
I found something that fixes both problems: Eurostat publishes monthly passenger counts for every airport in the EU. I compared them with the press releases:
- Bratislava: the Eurostat figure matches the airport’s own to the passenger (for example May 2026: 398,639, August 2026: 625,742).
- Vienna: Eurostat counts differently and comes out 1 to 3 % higher than Flughafen Wien.
So Eurostat is used only to fill months the airport didn’t publish, and it is clearly labelled in the report. Its year-over-year change is computed inside Eurostat’s own series, so two methodologies are never mixed. The result for July 2026: Bratislava 619,902 passengers (+72.7 %), Vienna 3,163,309 (−4.7 % on Eurostat’s basis).
Keeping the data fresh
The public version of the report kept showing data from 2 October. The reason was technical: Power BI Service doesn’t trust the certificate Supabase uses for direct database connections. The report now reads the data through Supabase’s public interface, which uses a standard certificate and is read-only. The last-refresh time is always in UTC, so it shows the same thing in Desktop and in the service.
Behind the scenes
I didn’t pick the colours by eye. I validated them for colour-blind readers and for the dark background: my first palette turned out too light in dark mode, so I adjusted it. White text on the cards has a contrast of 15:1, muted text 6.9:1 and red 6:1, all above the 4.5:1 threshold. The whole report is a Power BI Project (PBIP) generated by a script, so it lives in Git and can be reproduced.
See the live dashboard